


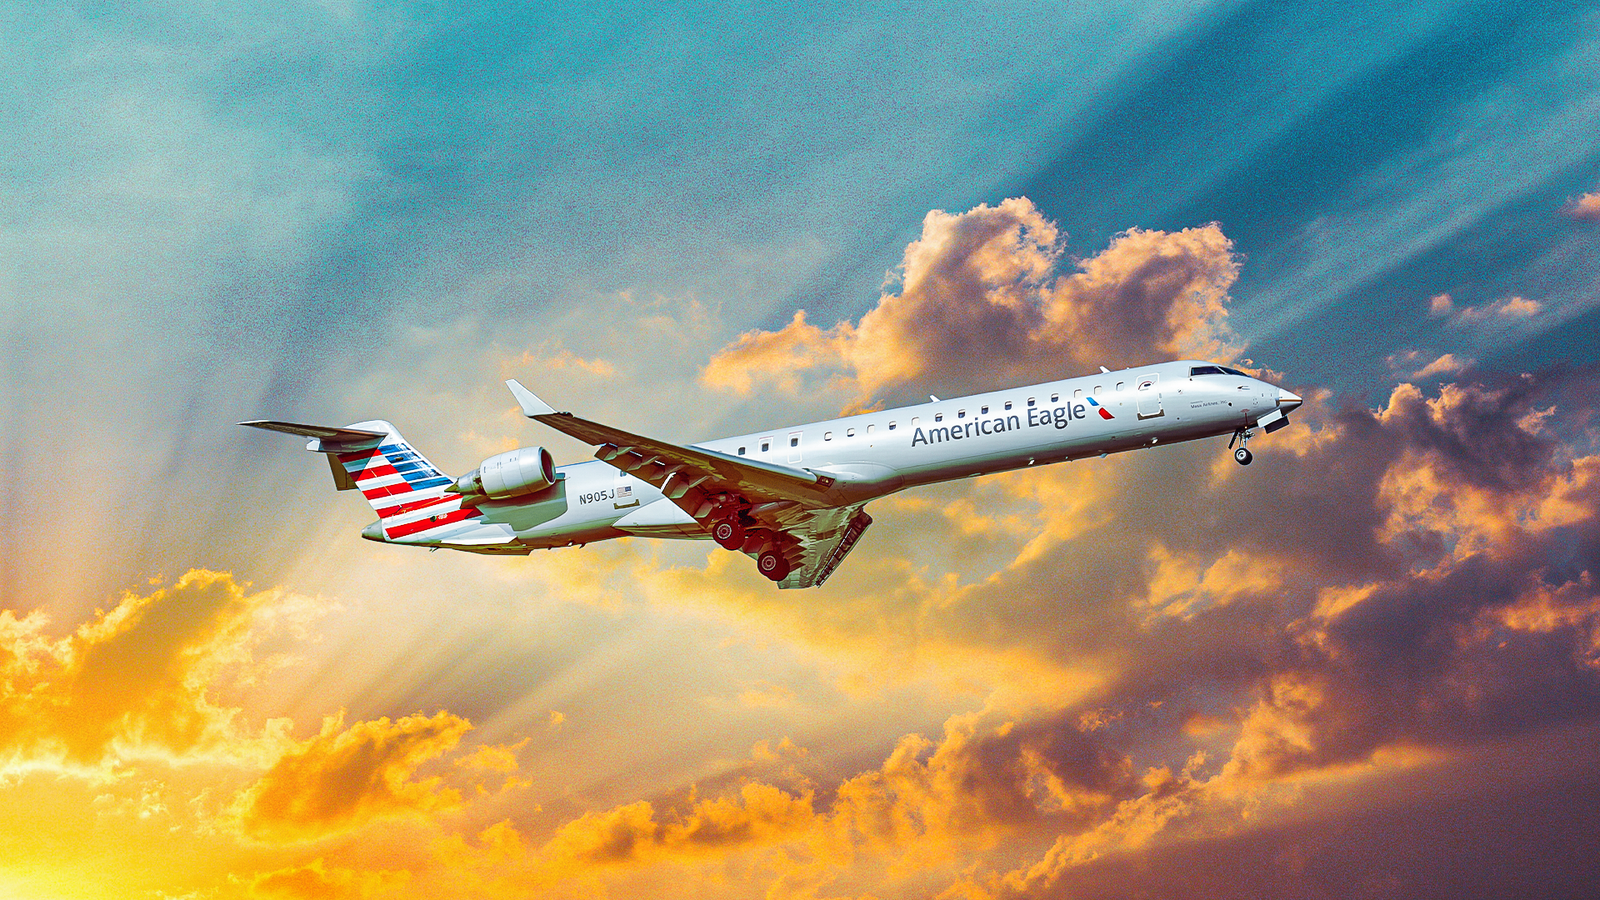
The Bombardier CRJ900 has been a fixture of North American regional flying since 2001, carrying passengers between smaller cities and major hubs for Delta Air Lines,  American Airlines, and
  United Airlines through their regional partners. Published fuel burn figures for the aircraft vary from 280 gallons per hour to 655, which makes the question of how much fuel it actually uses harder to answer than it should be.
Route-level data from Aircraft Commerce’s Owner’s and Operator’s Guide to the CRJ family gives a usable answer. Measured across eight real city pairs in an 88-seat configuration, the CRJ900 returns roughly 33 passenger-miles per gallon on a 139 nautical mile sector and roughly 60 on a 573 nautical mile sector, burning between 545 and 585 gallons per hour block. In the 76-seat configuration US scope clauses produce, those figures fall by about 14%. Both the Airbus A220 and the Embraer E195-E2 exceed 100 passenger-miles per gallon.
The Short Answer: Roughly 33 To 60 Passenger Miles Per Gallon

Ask how many miles per gallon a car gets, and there is a single answer. Ask the same question about an aircraft and the answer depends on how far it is flying, how many seats are installed, and how many of those seats are occupied. For the Bombardier CRJ900, the useful measure is passenger miles per gallon: how far the aircraft moves one passenger on one gallon of fuel. On that basis, the CRJ900 returns roughly 33 to 60 passenger-miles per gallon.
Those figures come from Aircraft Commerce’s Owner’s and Operator’s Guide to the CRJ family, which published block fuel data for a CRJ900EP across eight real-city pairs in an 88-seat configuration. On a 139 nautical mile (160 mile) sector from Calgary to Edmonton, the aircraft burned 428 gallons, or 4.86 gallons per seat, which works out to approximately 33 passenger-miles per gallon with every seat filled. On a 573 nautical mile (659 mile) sector from Toronto to Thunder Bay, it burned 972 gallons, or 11.05 gallons per seat, which works out to approximately 60 passenger-miles per gallon. The aircraft is the same. The fuel efficiency nearly doubles.
Both figures assume a 100% load factor, which no airline achieves consistently. At a more typical 85% load, the same sectors return roughly 28 and 51 passenger-miles per gallon, respectively. The 88-seat configuration also does not reflect how the aircraft is flown in the United States, where it is capped at 76 seats. Those two adjustments move the real-world numbers down considerably from the headline range, and both are covered below. What holds across every configuration and every load factor is the underlying pattern: the CRJ900 gets meaningfully better fuel economy the further it flies.
Fuel Burn Per Hour, And Why The Published Numbers Disagree

Published hourly fuel burn figures for the CRJ900 disagree by more than a factor of two. One widely republished specification sheet lists 396 gallons per hour as an average. Another puts it at 655 gallons per hour. The operating cost page gives 280 to 320 gallons per hour in cruise, though the same page lists the CF34 engines at 9,220 lbf of thrust when the CF34-8C5 is rated in the 14,000 to 14,500 lb class, which is reason enough to set that source aside.
The Aircraft Commerce route data allows the figure to be derived rather than taken on faith. Dividing block fuel by block time across the eight sectors produces a consistent range of roughly 545 to 585 gallons per hour. The Toronto to Thunder Bay sector burned 972 gallons in 104 minutes, or 561 gallons per hour. Boston to Toronto burned 896 gallons in 93 minutes, or 578 gallons per hour. Calgary to Edmonton, the shortest sector in the set, burned 428 gallons in 44 minutes, or 584 gallons per hour.
The spread between published figures comes down to what is being measured. Block fuel covers the entire gate-to-gate operation, including taxi, takeoff, climb, cruise, descent, and taxi, which is what the Aircraft Commerce numbers reflect. Cruise fuel measures only the level portion of the flight where an aircraft burns the least, and will always produce a lower hourly figure. The shortest sector shows the highest hourly rate because takeoff and climb make up a larger share of a 44-minute flight than a 104-minute one. Any single hourly number for an aircraft averages across conditions that vary substantially, which is why the same aircraft can credibly be described as burning 396 or 584 gallons per hour, depending on what the author counted.
Why Stage Length Matters More Than Anything Else

The clearest way to see how stage length affects the CRJ900 is fuel per seat-nautical-mile, which strips out both the aircraft’s size and the length of the flight. Across the eight sectors Aircraft Commerce measured, that figure falls from 0.035 gallons on the 139 nautical mile Calgary to Edmonton run to 0.019 gallons on the 573-nautical-mile Toronto to Thunder Bay sector. The aircraft is 46% more fuel efficient per seat-mile on the longer flight, with the same configuration and engines.
Takeoff and climb explain most of the gap. Getting 84,500 pounds (38,328 kg) of aircraft from the runway to cruise altitude consumes a large and fixed amount of fuel regardless of where the flight is going. On a 573-nautical-mile sector, that fuel is spread across 573 miles of progress. On a 139 nautical mile sector, the aircraft has barely reached cruise before it begins descending, and the same climb fuel is amortized over a quarter of the distance. Cruise is the efficient phase of any flight, and short sectors include very little of it.
The Aircraft Commerce data also shows how sensitive the numbers are to conditions that have nothing to do with the route. A Toronto to Boston flight burned 728 gallons over 392 nautical miles, while the return leg burned 896 gallons over 508 nautical miles, reflecting a 65-knot headwind that pushed the effective distance flown well beyond the great-circle figure. The guide notes that fuel burn per seat increases roughly in line with stage length, but the relationship is not clean from one day to the next.
The practical consequence is that the CRJ900 performs worse on precisely the flying it was designed to do. Regional jets exist to serve thin markets on short sectors feeding hub connections, and a large share of CRJ900 flying in North America falls in the 150 to 400 nautical mile band where the aircraft’s per-seat-mile efficiency has not yet reached its best figures.
The Scope Clause Penalty

The Aircraft Commerce figures assume an 88-seat configuration, close to the CRJ900’s maximum certified capacity of 90. No US airline flies it that way. Pilot union scope clauses limit the size of aircraft that mainline carriers can hand to their regional partners, and CRJ900s operating in the United States are configured with 76 seats as a result. Delta’s Endeavor Air subsidiary flies the type in a 76-seat layout, as does SkyWest.
Removing 12 seats does not reduce the aircraft’s fuel burn. The airframe weighs nearly the same, the engines produce the same thrust, and the flight consumes the same fuel. What changes is how many passengers share that fuel. On the 573 nautical mile Toronto to Thunder Bay sector, 972 gallons across 88 seats produces 11.05 gallons per seat. The same 972 gallons across 76 seats produces 12.79 gallons per seat, 15.8% more fuel for every passenger carried. Put another way, the best-case efficiency figure falls from about 60 passenger-miles per gallon to about 52.
The shorter sectors take the same proportional hit. Calgary to Edmonton at 76 seats works out to roughly 28 passenger-miles per gallon rather than 33. At a realistic 85% load factor, a 76-seat CRJ900 on a typical short regional sector delivers closer to 24 passenger-miles per gallon in practice.
Scope clauses were never written with fuel efficiency in mind. They exist to protect mainline pilot jobs by limiting how much flying can be handed to lower-cost regional subsidiaries. The effect on the CRJ900 is that US operators fly an aircraft designed for 90 passengers with 14 seats removed, absorbing the fuel cost of the full airframe while selling 76 tickets. That penalty applies to every flight the aircraft operates.
How It Compares To What Is Replacing It

The aircraft replacing the CRJ900 are roughly twice as efficient per passenger. Simple Flying’s efficiency analysis found that both the Airbus A220 and the Embraer E195-E2 routinely exceed 100 passenger-miles per gallon. Against the CRJ900’s best case of approximately 60 at 88 seats, or 52 in a US 76-seat configuration, the generational gap is not incremental.
Engine technology accounts for much of it. The CF34-8C5 powering the CRJ900 traces its core to a design certified in the 1990s, with a relatively low bypass ratio by current standards. The A220 uses the Pratt & Whitney PW1500G and the E-Jet E2 family uses the PW1900G, both geared turbofans with bypass ratios above 10:1. The gearbox allows the fan to turn slower than the turbine driving it, letting each operate at its own optimum, which is the central reason the newer aircraft move more air at lower velocity and burn less fuel doing it. Airframe design also contributes, with newer wings, lighter structures, and aerodynamic refinements that did not exist when the CRJ900 entered production in 2001.
The newer aircraft also carry more passengers, so that fuel is divided among more people. The A220-100 seats up to 135 and the A220-300 up to 160, against 76 on a US-configured CRJ900. Better fuel burn and a larger cabin improve the per-seat math from both directions at once, which is why carriers replacing CRJ fleets with A220s see the efficiency gain compound rather than add.
None of this made the CRJ900 a poor aircraft for its era. It filled the gap between 50-seat regional jets and mainline narrowbodies for two decades, and Global Air rates it as more efficient per seat-mile than the original Embraer 175 it competed against. The comparison that matters now is against aircraft designed 15 years later, and against those, a regional jet returning 33 to 60 passenger-miles per gallon is one on its way out of the fleet.
CRJ900 Fuel Economy: What Makes the Difference?
