


Chart of the Week: Reefer rejection rate – Fresno, USDA Produce spot rate, TRAC reefer spot rate – Fresno to Chicago, SONAR: STRIR.FAT, AGRATE.FATCHI
Tender rejection rates in Fresno, California have climbed from below 4% in early March to above 14% in less than a month — the highest level since June of last year. Produce spot rates reported by the USDA have increased nearly 25% over the past few weeks on lanes from central California to Chicago. General reefer spot rates on the Fresno-to-Chicago lane, as measured by SONAR TRAC data, have jumped 43% over the past month, reaching their highest level since 2022. These data points come from separate sources and are collectively sending a strong signal that produce season has begun in the West.
For those unfamiliar, there are multiple regions of the country where seasonal harvests can have a significant impact on truckload capacity. Growers need to move their product quickly to preserve freshness and avoid spoilage, which creates a natural sense of urgency — one that is most acute in the early stages of the harvest, when demand for the first batch is at its peak.
California accounts for the lion’s share of North American lettuce and cruciferous vegetable production. During the winter months, production shifts to Arizona and Mexico as crop rotation schedules and weather conditions require.
The first major harvest of the year out of California typically begins around mid-April, though it can be delayed by weather-related impacts on planting schedules and harvest capability.
Produce harvests have had little impact on the truckload sector over the past few years, as the market was fairly oversupplied and able to absorb seasonal demand pressure. That environment has given way to a considerably tighter market to start this year.
Produce season can affect nationwide trucking capacity as carriers gravitate toward the West to move high-paying produce loads. Shippers in that space will pay transportation premiums, knowing that the cost of losing yield to spoilage is significant. This draws capacity away from less financially attractive freight.
According to the USDA, shipments of lettuce, strawberries, and broccoli have just begun moving out of the Central Valley over the past few weeks — meaning the bulk of the season is still ahead.
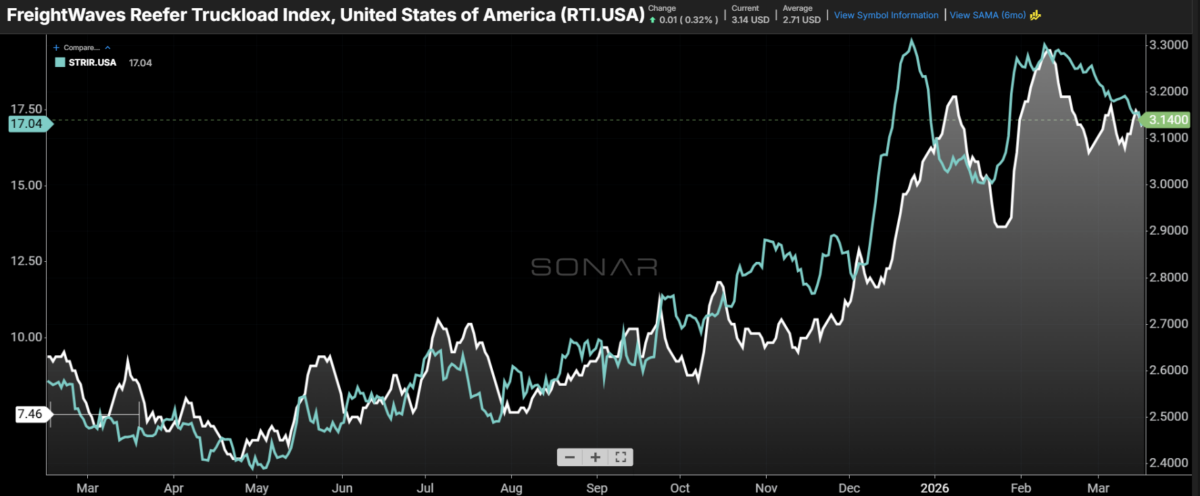
The refrigerated truckload market has shown tentative signs of stabilization since early February, though it remains tight. National reefer rejection rates (STRIR) peaked just below 20% in early February and have been trending lower since, sitting around 17% late last week. Spot rates (RTI) have been more uneven — possibly due to fuel — but peaked around the same time and were running about 11% below their peak last week.
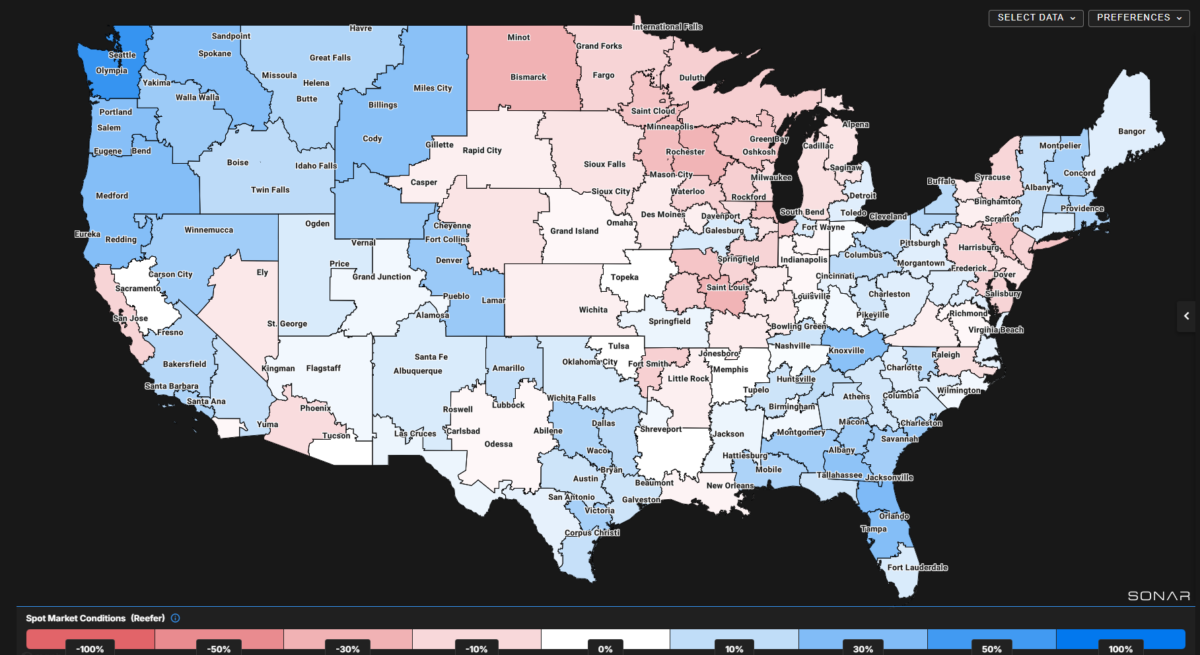
A heat map of reefer spot rate movement late last week showed significant declines across the Midwest, while the southern tier and the lower-volume Northwest were mostly seeing increases.
Weather is an added complication, as the near-term forecast for the region is wet, which could impede harvests and heighten urgency once they resume. The market has already demonstrated its fragility, and this produce season has the potential to send it reeling once again after years of being a non-factor.
About the Chart of the Week
The FreightWaves Chart of the Week is a chart selection from SONAR that provides an interesting data point to describe the state of the freight markets. A chart is chosen from thousands of potential charts on SONAR to help participants visualize the freight market in real time. Each week a Market Expert will post a chart, along with commentary, live on the front page. After that, the Chart of the Week will be archived on FreightWaves.com for future reference.
SONAR aggregates data from hundreds of sources, presenting the data in charts and maps and providing commentary on what freight market experts want to know about the industry in real time.